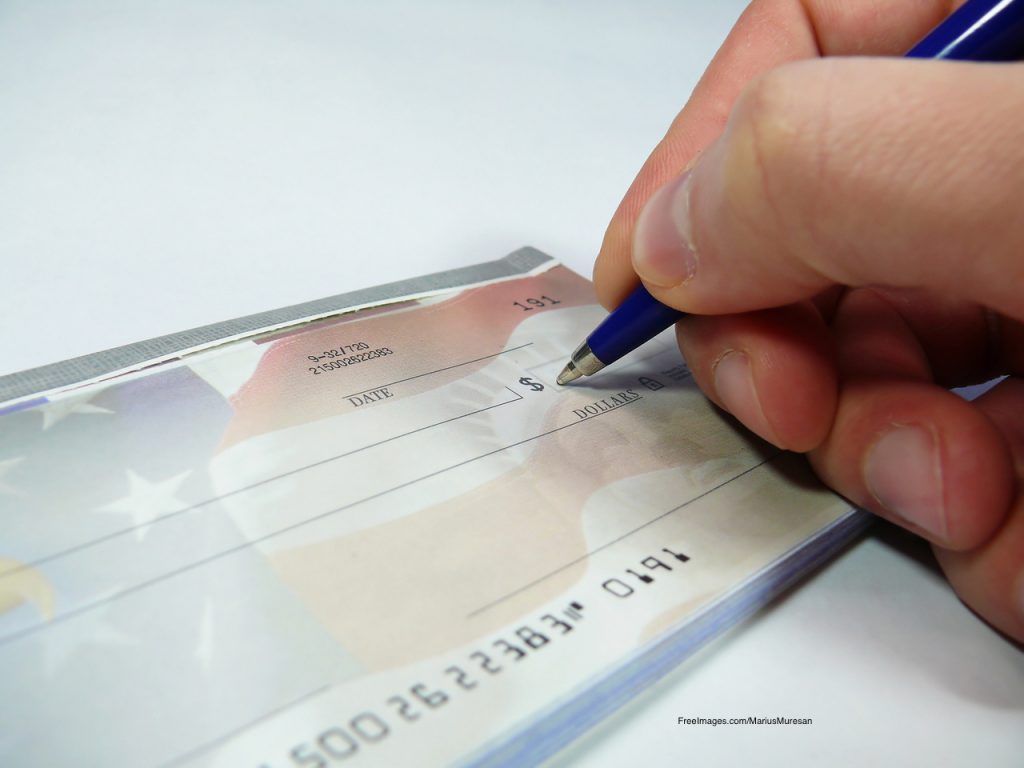
The decline of checks over recent decades is a well-known story, but there were still 14.5 billion check payments in 2018, according to Federal Reserve research. So just who’s still writing checks, and for what kinds of payments?
“All things being equal, older, low-income, non-minority group members are more likely to pay with paper checks,” says a new report from the Federal Reserve Bank of Atlanta. “Allowing for demographics and household income, consumers are more likely to use checks for higher-dollar-value payments for utilities, rent, charitable donations, government taxes and fees and building contractors. Compared with other types of income, rental income and self-employment income are more likely to be paid by check.”
The report is based on data collected through several Federal Reserve banks’ Diary of Consumer Payment Choice research projects in 2017 and 2018. Nearly 3,100 unique respondents provided detailed histories of their payment transactions for the diaries.
According to the new study, businesses write the majority of checks, but consumers used them for 7% of all transactions in the two years. They wrote about three checks per month.

Checks had a relatively high average dollar value compared to transactions using other payment instruments, around $300 versus $84 for other transactions. The median dollar value of checks written in the two years was $100, and three-quarters of checks were for less than $250.
“By number, most checks were written to pay merchants traditionally associated with household bills (57%),” the report says. “Of checks not used to pay bills, 7% were written to pay another person (P2P), 12% were charitable or religious donations, and 6% were to grocery stores and gas stations. One percent were used to make a transfer from one account to another while the remaining 17% were written to pay other merchants.”
The study shows clear generational preferences for checks. Paper checks commanded zero percent of all payments by consumers under age 25, according to the 2018 diary compilation. At the opposite end, checks claimed 9% of payments among those aged 65 or older. In between, checks took 7% of payments among the 55-to-64 age group, 5% for those ages 45-54, and 3% for both the 35-44 and 25-34 groups.
The number of checks written by consumers declined from 19.3 billion in 2000 to 7.1 billion in 2015, a decline of 63%, the report says.


